Still using var_dump to debug your PHP code? Stop! While var_dump can be convenient, it’s a very blunt approach. In this article, I’ll show you how to set up proper debugging with PhpStorm, Xdebug, and PHPUnit, and give you a modern, sophisticated debugging experience.
Recently, I’ve been developing a side-project, and have had to create several dependent packages to support it.
These dependent packages perform several smaller tasks, ones that don’t belong in the main package.
One example is a package called currency-filter.
Its task is to filter a European-format currency string, such as -1.432.156,54 into its integer equivalent.
In this case, it would be -143215654.
Not such a tricky request, you might think.
But the more test data I fed the code, the more use cases I found which needed to be handled.
Have a look at the project’s tests for a full list, but here’s a short list.
- 1.00,00
- -3500,00
- -3.500,01
- -4.501,2
- 1.887.761.234
- 1.887.761.234,01
- 1.887.761.234,2
- 1887761234,2
- 1887761234,21
- 1887761234,2
- 1887761234
- 1234.24
In the early stages of development, in some cases, the tests validated that the expected values were being returned.
However, in others, the values that I expected to be returned, weren’t.
Instinctively (wrongly) I started using PHP’s var_dump method to attempt to see what the value being returned was.
Well, if you’ve ever tried to var_dump a variable in the middle of a PHPUnit test, then you’ll know that PHPUnit doesn’t take kindly to that.
Not only did I not see the value that I wanted, I saw an unwieldy stack trace instead.
So, what’s a man to do.
I needed to know what was being returned, but the ham-fisted way I was attempting to find it wasn’t working.
The solution was to use use step-through debugging in PhpStorm.
If you’re not familiar with step-through debugging, it’s where you, as the name implies, step through your code, one line at a time.
Setting Up Step-Through Debugging in PHP
Gladly, to set it up in PHP, you don’t need a lot.
All you need are three things:
- PHP with Xdebug
- PHPUnit; and
- Your IDE or editor of choice.
Whenever I write PHP code, it’s reasonably safe to say that I use PhpStorm.
So that’s why, in this article, I’m going to show you how to integrate Xdebug, PHPUnit, and PhpStorm.
On Small Caveat
This article doesn’t cover debugging web-based applications with PhpStorm, but smaller code libraries.
Getting (remote) debugging setup for web-based applications can be a finicky and intricate affair at times, depending on the structure of your development environment.
What You’ll Need
You won’t need very much to follow along with this tutorial, just the following:
- A recent release of PhpStorm (I’m using 2019.2.3)
- An installation of PHP (I’m using 7.3.10)
- A package manager (such as Apt on Linux, Homebrew on macOS, or Chocolatey on Windows)
- About 10 minutes of your time
Want to Learn More About Mezzio?
Mezzio Essentials teaches you the fundamentals of PHP's Mezzio framework. It's a practical, hands-on approach, which shows you just enough of about the underlying
principles and concepts before stepping you through the process of creating an application.

The first thing that we need to do is to add Xdebug support to our PHP binary.
To do that, I strongly encourage you to use the package manager on your Linux distribution, or a package manager for your operating system, such as Homebrew on macOS.
For the examples in this article, I’m going to assume that you’re running a Debian-based Linux distribution, such as Debian, Ubuntu, or Linux Mint.
However, please adapt them to your package manager of choice.
To install Xdebug, run the following command:
sudo apt-get install -y php-xdebug
Then, once Xdebug is installed, you need to ensure that it’s both enabled and properly configured.
The package manager will most likely enable it, but to be sure run the following command.
php -m | grep -i xdebug
If you see “Xdebug” in the output, then it’s installed and enabled.
Now we need to configure it properly.
To do that, we need to ensure that remote_enable is enabled.
First, we need to find the relevant configuration file.
We can find it by running the following command.
php --ini | grep xdebug
This should output something like /etc/php/7.3/cli/conf.d/20-xdebug.ini to the console.
Open that file in your favourite editor of choice, and add the following line:
xdebug.remote_enable=1
Save the file, and then check that the setting’s taken effect, by running the following command:
php --ri xdebug | grep remote_enable
You should see xdebug.remote_enable => On => On printed to the console if the setting’s taken effect.
Configuring PhpStorm’s PHP Setup
Now that Xdebug’s installed and configured, we need to configure PhpStorm.
To do that, in PhpStorm’s settings, under “Languages & Frameworks -> PHP”, click on the More button, next to the CLI Interpreter dropdown list, which you can see an example of in the screenshot below.
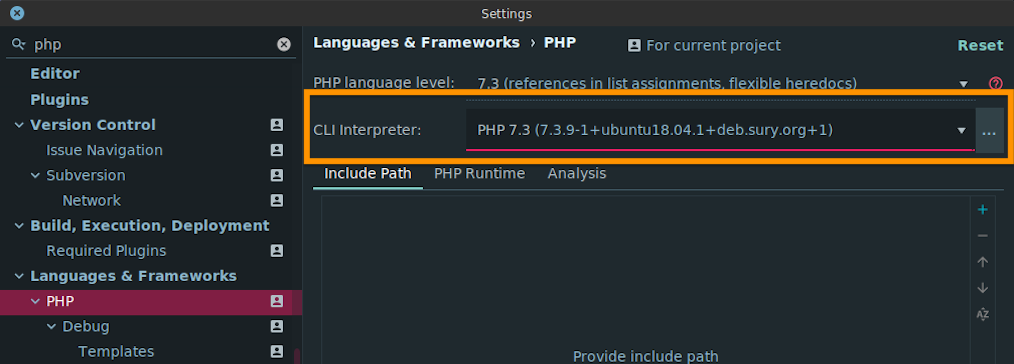
That will show you the list of configured PHP interpreters.
Select your version of PHP in the left-hand column.
Next, ensure that “Xdebug” is written next to “Debugger”, as in the screenshot below.
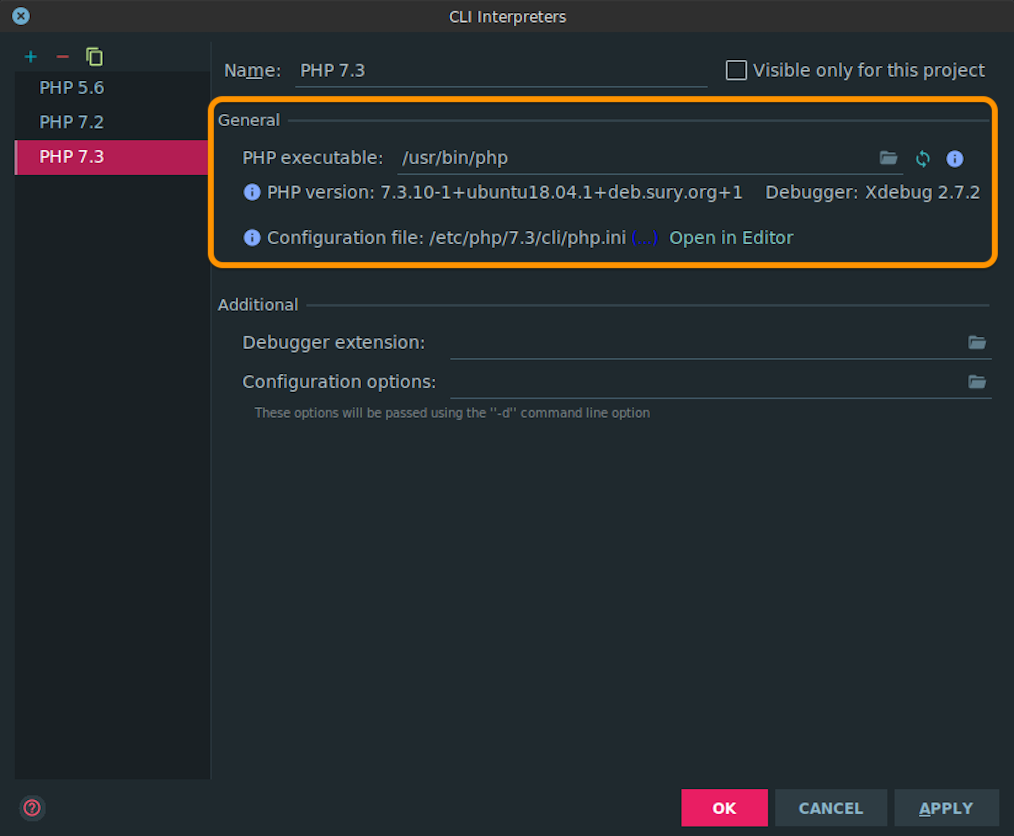
If it is, then PhpStorm is working with a PHP binary that has Xdebug support available.
Configuring PhpStorm’s PHPUnit Support
Now, we need to ensure that PhpStorm has PHPUnit integration set up correctly.
To do that, open PhpStorm’s settings dialog and filter by either “phpunit”, or navigate to “Languages & Frameworks -> PHP -> Test Frameworks”.
If there are no configurations listed in the middle column, click on the plus button to add one.
In the popup that appears, choose “PHPUnit Local”.
Next, we need to configure how PHPUnit is available on your system.
There are three choices:
- Use Composer autoloader
- Path to phpunit.phar
- Load from include path (PEAR)
I commonly include PHPUnit on a per-project basis via Composer, as a development requirement.
So that’s the option I’m going to step through in this example.
Given that, I’ll choose “Use Composer autoloader”.
After doing that, click the folder on the far right-hand side of “Path to script:”.
In the file browser dialog that appears, find and select Composer’s autoloader (vendor/autoload.php) in your project.
After doing so, if you click the reload icon, next to the autoloader path, you should see a green confirmation message, telling you that the PHPUnit version information has been successfully updated.
Also, you’ll see the version of PHPUnit printed below the path, next to “PHPUnit version”.
With that done, click “OK” to close the settings window.
Set One Or More Breakpoints In Your Project
Now that we’ve completed all of the required setup and configuration, it’s time to set one or more breakpoints in our code and start the debugger.
In the screenshot below, you can see that I’ve set a breakpoint on an arbitrary line in one of the source files of my project.
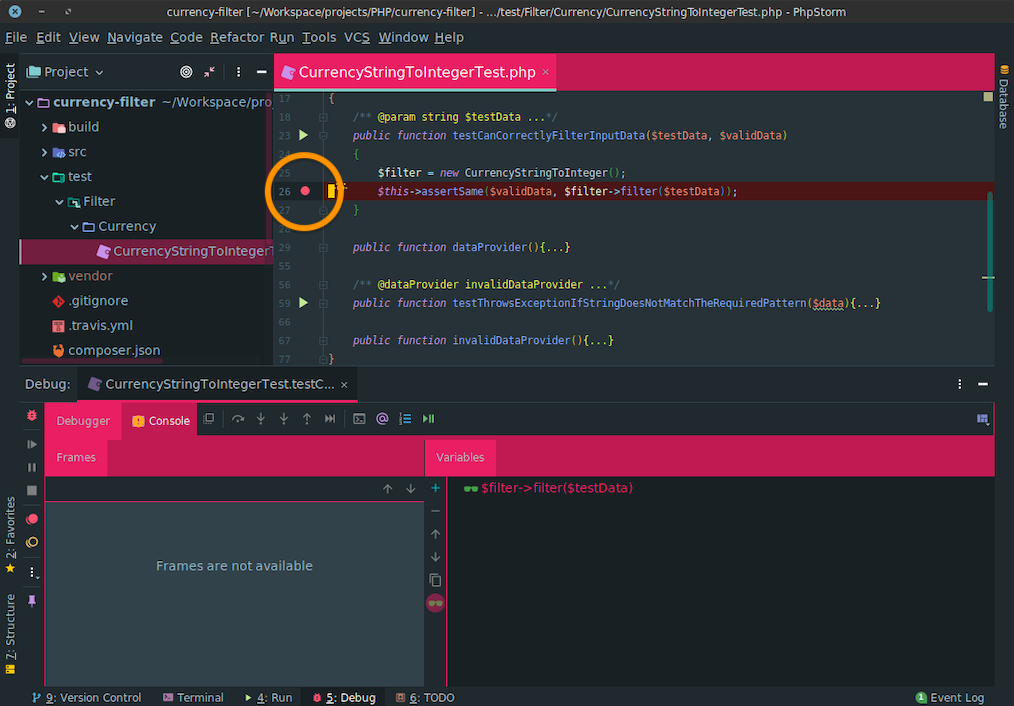
To do that in your project, click on the file gutter, on the line that you want to set a breakpoint.
If you click the right area, a red icon will appear, indicating that you have set a breakpoint, and the line will also be highlighted in red (allowing for your theme).
To remove it, click that spot again.
Start Step-Through Debugging
Now, you’re ready to start the step-through debugger.
There are multiple ways to do this; however, my preferred approaches are:
- Clicking the arrow next to the name of the test that you want to run, and clicking the second option, starting with “Debug”
- Right-clicking the desired test file and clicking the option starting with “Debug” (most of the way down the list)
- Opening the Debug panel and clicking the debug button.
Pick the way that you prefer and launch the debugger.
Depending on the speed of your development machine, the debugger will stop at the breakpoint and list the execution path to that line in your code in the Debug panel’s Frames window and list one or more variables in the Variables window.
In the example below, you can see that I have seven variables listed in the Variables window.
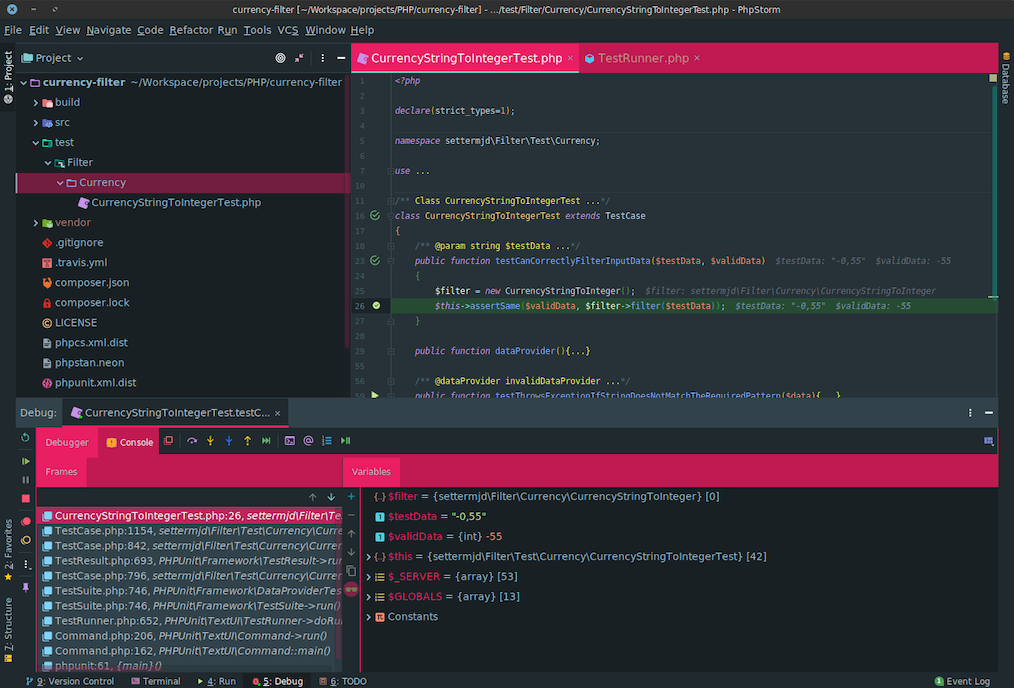
In particular, you can see the value of the variable being passed to the method that I’m debugging $filter->filter(), the value that it’s being compared with $validData.
However, what it doesn’t have is the return value of that function.
To add that, I’ll select the function call, right-click, and select “Add to watches”.
That then adds the function call to the Variables window and shows the value that it will return.
From here, several other options are available.
These are:
- Show Execution Point
- This navigates you to the code that is currently executing.
- Step Over
- Executes the next line, jumps to the line after and pauses.
- Step Into
- If the next line of the code is a function call, the code pauses at the first line of the function.
- Step Out
- This executes the remainder of the current function and returns you to the caller, and pauses.
- Run to Cursor
- This will execute all the code between the current breakpoint and where the cursor has been placed.
- Evaluate Expression
- This opens a dialog that allows you to evaluate a custom expression, based on the current code state.
- Force Step Over
- This enables you to jump over the method call, ignoring the breakpoints.
- Force Run to Cursor
- This enables you to jump to the cursor position while ignoring existing breakpoints on the way.
In Conclusion
And that’s how to setup PHP debugging with PhpStorm, Xdebug, and PHPUnit.
Sure, there are several steps involved, but they’re more or less straight-forward, and logical.
Secondly, they shouldn’t take much time to complete, perhaps 5 - 10 minutes.
Plus, when they’re done, they make knowing, with precision, exactly what your code is doing at any moment in time effectively trivial, whether you’re executing code directly, or testing it with PHPUnit-based unit tests.
What’s more, you can stop using the large hammer that is var_dump, and avoid littering your code with such statements that you later have to remove.


Join the discussion
comments powered by Disqus