In versions of Xdebug before version 3 setting up step debugging for code inside Docker containers has often been challenging to say the least. However, in version 3 it’s become almost trivial. In this short tutorial, I’ll step you through what you need to do, regardless of the (supported) text editor or IDE you’re using.
What will you need?
To follow along with this tutorial, make sure that you have Docker installed for your operating system, ideally the latest version, and one of Xdebug’s supported clients.
You can find all the instructions you need for installing Docker — regardless of whether you’re running Linux, macOS, or Windows — in the Docker documentation.
The base Docker Compose configuration
For simplicity’s sake, I’ll assume that your Docker Compose configuration, stored in docker-compose.yml in the root of the project directory, looks like the example below.
version: '3'

services:

  webserver:
    image: nginx:latest
    ports:
      - 8080:80
    volumes:
      - ./docker/nginx/default.conf:/etc/nginx/conf.d/default.conf
      - ./:/var/www/html

  php:
    build: ./docker/php/
    expose:
      - 9000
    volumes:
      - .:/var/www/html
You can see that it’s composed of two services: webserver and php.
This is because NGINX, in the webserver container, is communicating with PHP, in the php container, via PHP-FPM, on port 9000.
The application’s source code, regardless of whether it uses a framework such as Laravel, Mezzio, or Symfony or not, is located in the root directory of the project on the development machine and will be available to the container in /var/www/html.
Feel free to use whatever application you prefer to follow along.
TIP: If you’d like to learn more about creating a Docker Compose configuration, link:/docker-development-environment/[check out the series that I wrote on it].
Install Xdebug 3 in the PHP container
The php container uses a custom Dockerfile (./docker/php/Dockerfile) to define its build steps, which you can see in the example below.
This is because Xdebug doesn’t come “bundled” with the official Docker Hub PHP containers.
FROM php:7.4-fpm

RUN pecl install xdebug \
    && docker-php-ext-enable xdebug
However, it only takes two additional steps to install and enable it, as you can see above.
These are:
- Install it with Pecl
- Enable it using
docker-php-ext-enable.
This command saves us the hassle of writing a custom shell script.
With Xdebug installed and enabled, we need to enable step debugging.
To do that, create the two configuration files: docker/php/conf.d/xdebug.ini and docker/php/conf.d/error_reporting.ini; and the paths if you don’t have the directory structure set up yet.
To save some time, you can use the following commands to do so.
mkdir -p docker/php/conf.d
touch docker/php/conf.d/xdebug.ini
touch docker/php/conf.d/error_reporting.ini
In docker/php/conf.d/xdebug.ini, add the following configuration to configure Xdebug.
zend_extension=xdebug

[xdebug]
xdebug.mode=develop,debug
xdebug.client_host=host.docker.internal
xdebug.start_with_request=yes
Here’s what the settings do:
- mode: This setting controls which Xdebug features are enabled.
We’ve set
develop to enable development aids, such as getting better error messages, and debug to enable step debugging.
- client_host: This setting tells Xdebug the IP address or hostname of the machine that is running your text editor or IDE.
- start_with_request: This setting determines whether a function trace, garbage collection statistics, profiling, or step debugging are activated at the start of a PHP request. Setting it to
yes instructs Xdebug to always initiate a debugging session.
Then, in docker/php/conf.d/error_reporting.ini, add the following configuration, to enable full error reporting.
Always good to know what’s going wrong, if and when it does.
Then, in the php service definition in docker-compose.yml, add the following two entries to the volumes element.
- ./docker/php/conf.d/xdebug.ini:/usr/local/etc/php/conf.d/docker-php-ext-xdebug.ini
- ./docker/php/conf.d/error_reporting.ini:/usr/local/etc/php/conf.d/error_reporting.ini
With the ini files created and docker-composer.yml updated, to have the php container make use of them, restart and rebuild it by running the following command.
docker-compose up -d --build php
The --build flag builds images before starting containers.
It’s essential to use this flag because without it the changes that we made in docker/php/Dockerfile won’t take effect.
Do you need to get your head
around Docker Compose
quickly?
What about needing to dockerize existing applications to make them easier to
deploy, reducing the time required for developers to get started on projects, or learning how to debug
an existing Docker Compose-based app? Then this free book is for you!
Configure Xdebug in your IDE or text editor
Now that we’ve finished configuring the PHP container, we need to configure our client.
This will vary, depending on the client that you’re using.
For the purposes of this article, I’m using PhpStorm.
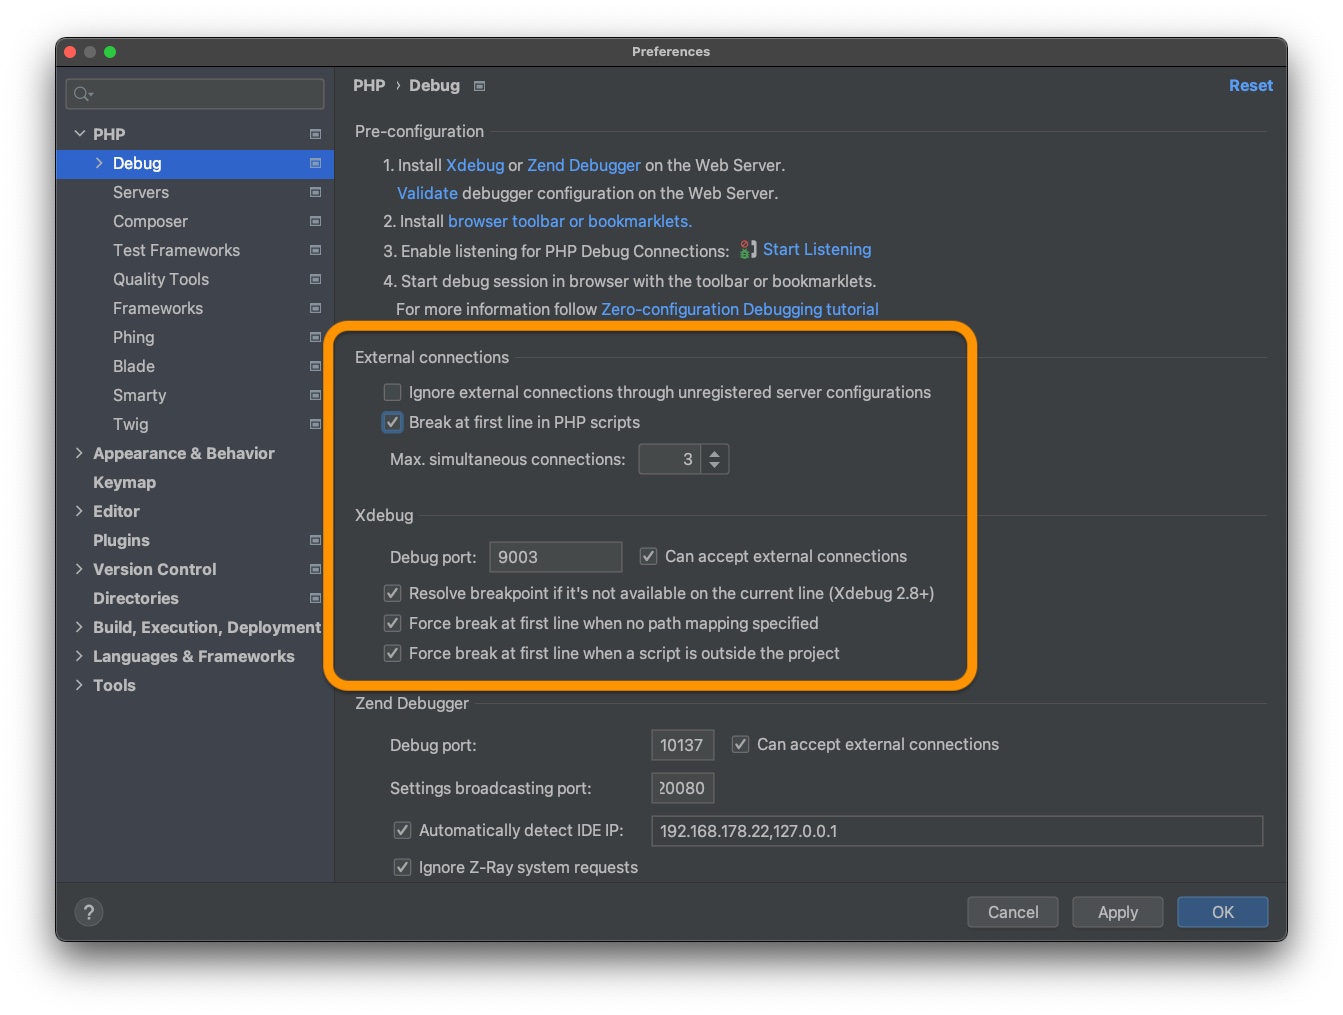
It’s default debug settings, which you can find under Settings > PHP > Debug > Xdebug, use Xdebug’s default values, which we’ve not altered in our configuration.
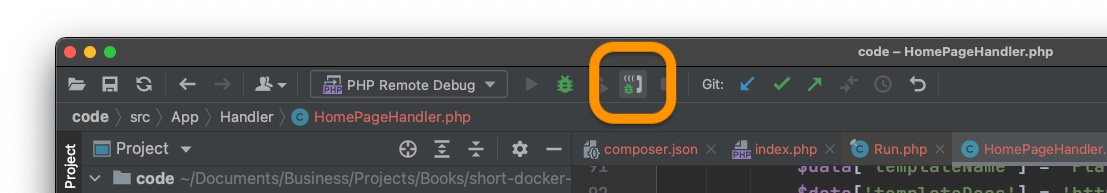
So the only thing that we need to do is to tell it to start listening for PHP Debug connections, by toggling the phone icon in the top menu bar.
However, I recommend enabling “Break at first line in PHP scripts” during initial setup, as an extra way of knowing whether step debugging works on first try, when no breakpoints are set.
Start using step debugging instead of var_dump
At this point, you need to use a supported text editor or IDE that knows how to talk to Xdebug with the open DBGp protocol.
The Xdebug documentation provides a list of clients that support it.
For the purposes of this guide, I’ll be using PhpStorm (version 2021.1 EAP at the time of writing).
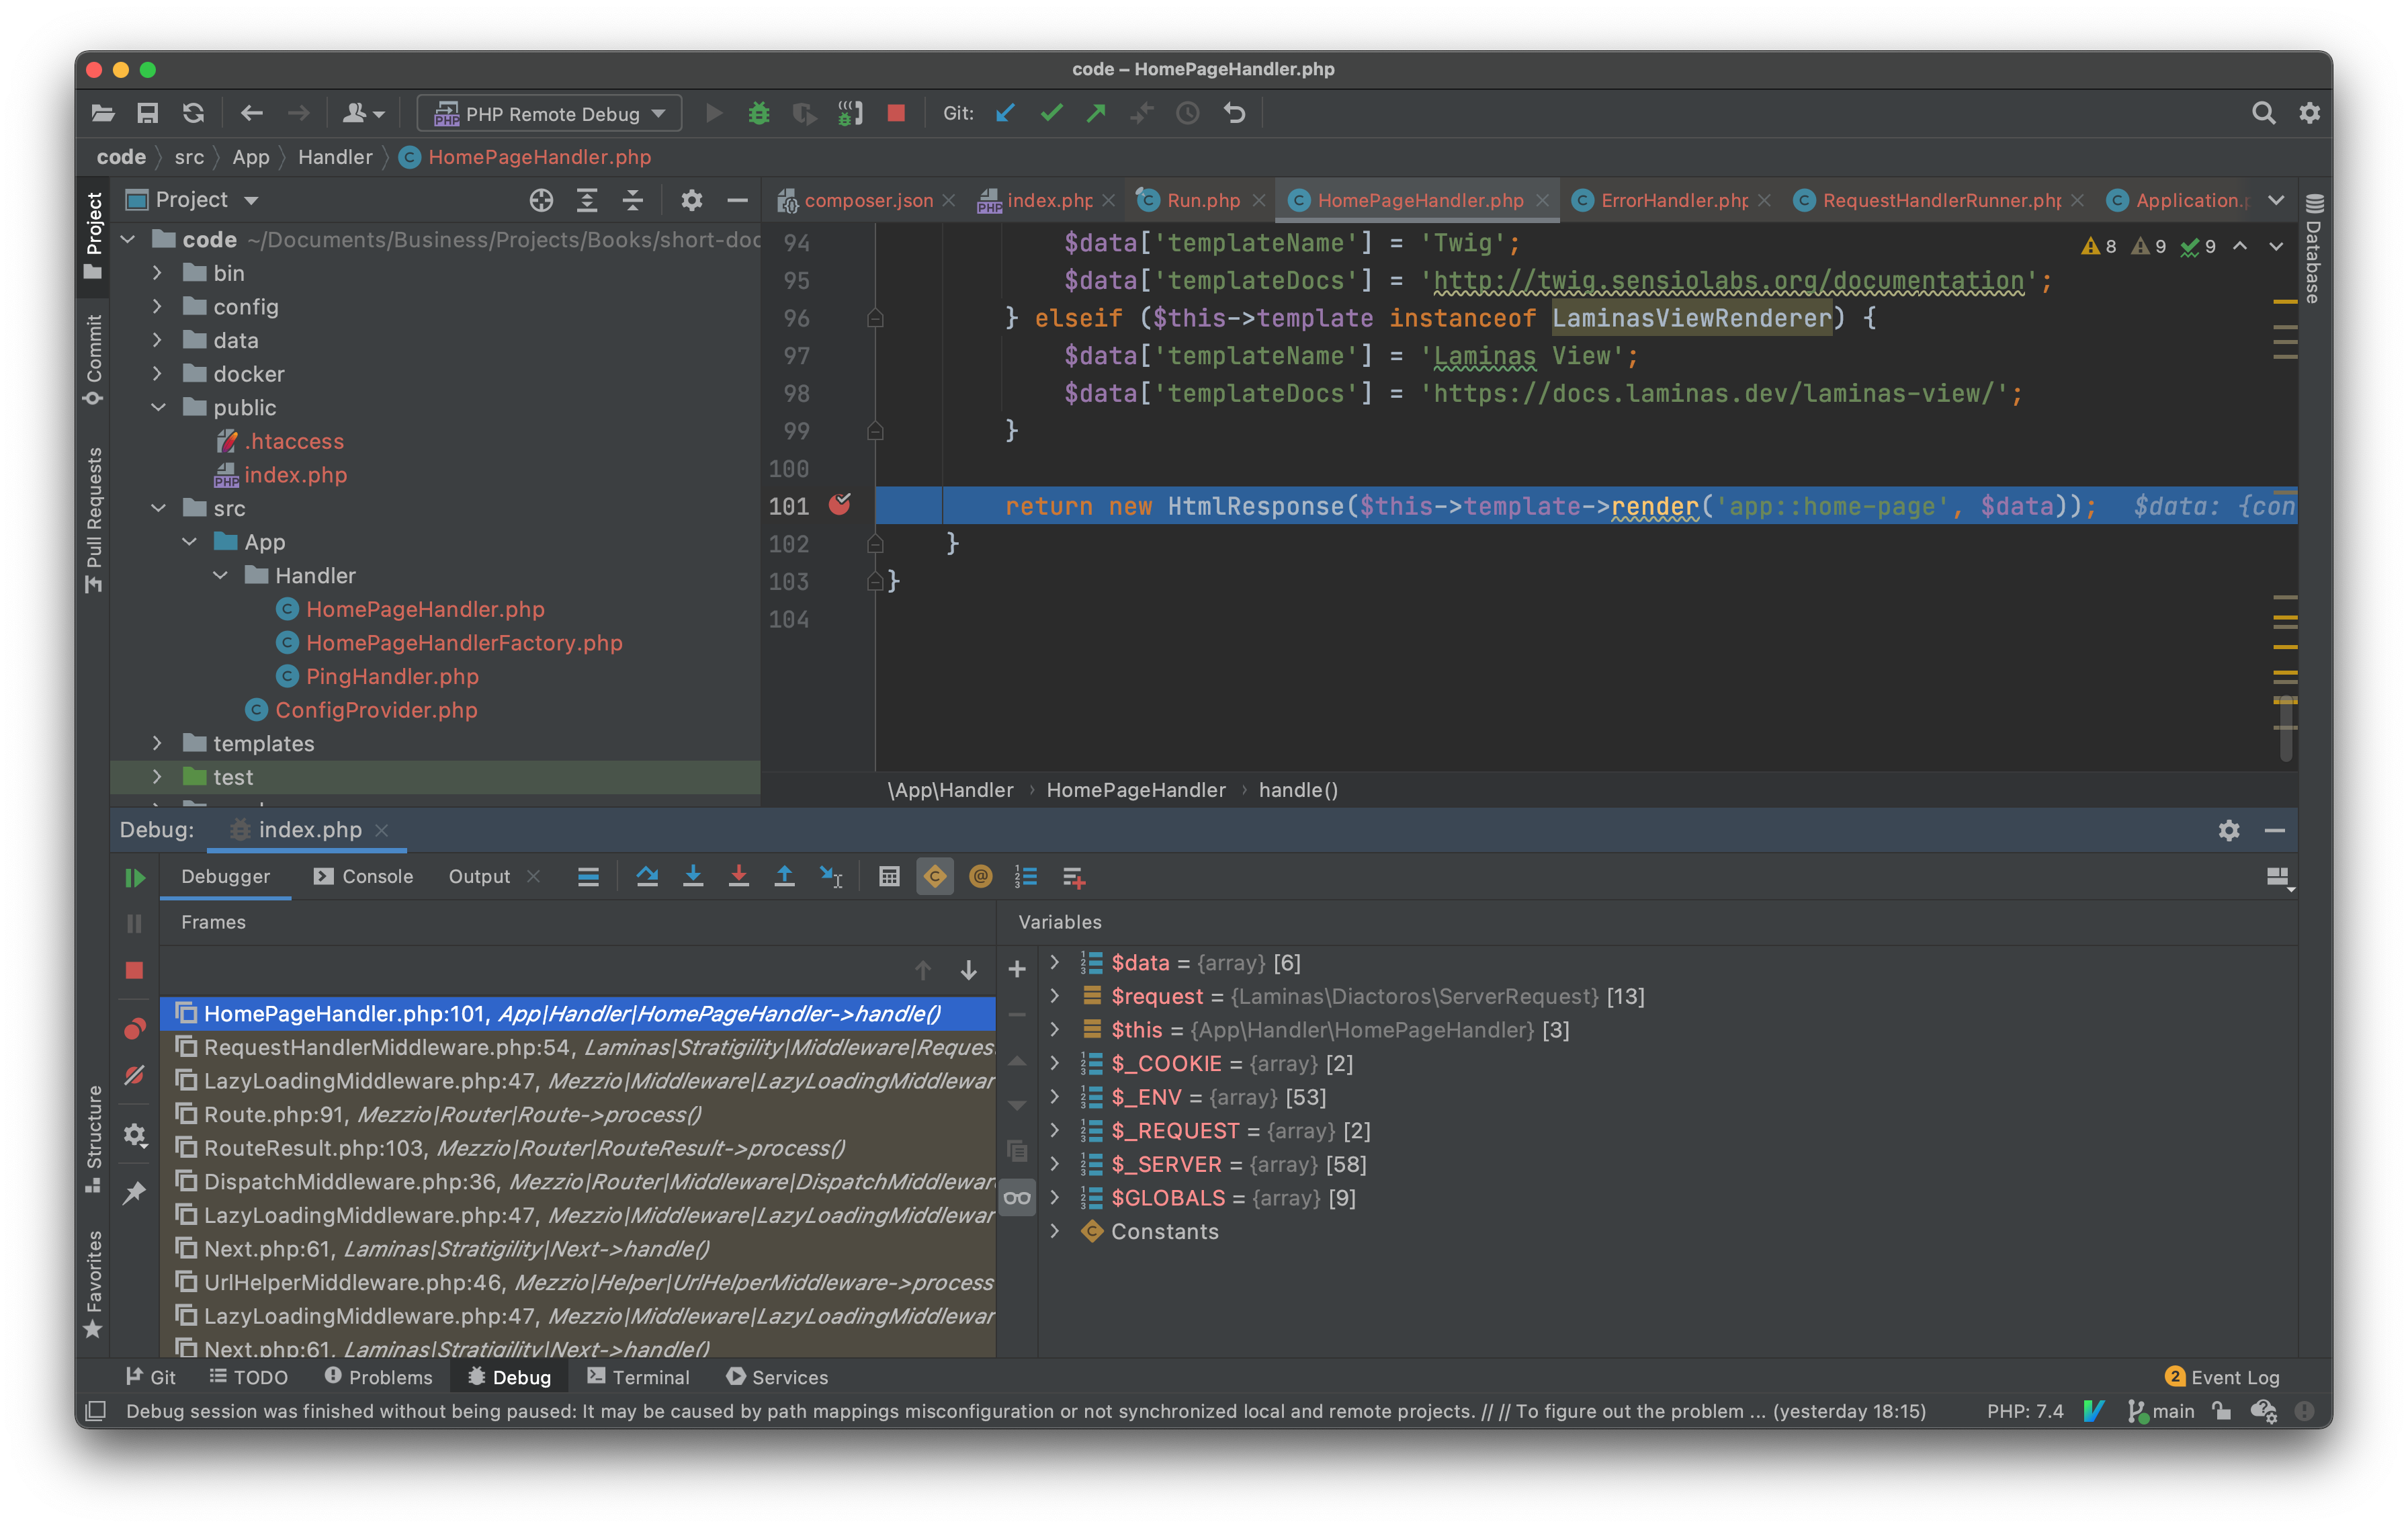
Regardless, once you have your IDE or text editor of choice setup and ready to go, open the project code and set a breakpoint.
Then, run the code in your browser.
All being well, you should see that the request doesn’t complete in your browser, rather your text editor or IDE takes focus and stops on the breakpoint.
You can see an example of this in PhpStorm in the screenshot below.
How to Troubleshoot Xdebug if it doesn’t work
If your text editor or IDE didn’t stop at the breakpoint that you set, then you’ll have to troubleshoot what might have gone wrong, by consulting Xdebug’s diagnostic log.
To view Xdebug’s diagnostic log, you could add the above code before the breakpoint and reload the page.
This is handy when you want to do some quick troubleshooting.
When you run the application again, you’ll see output similar to the screenshot below.
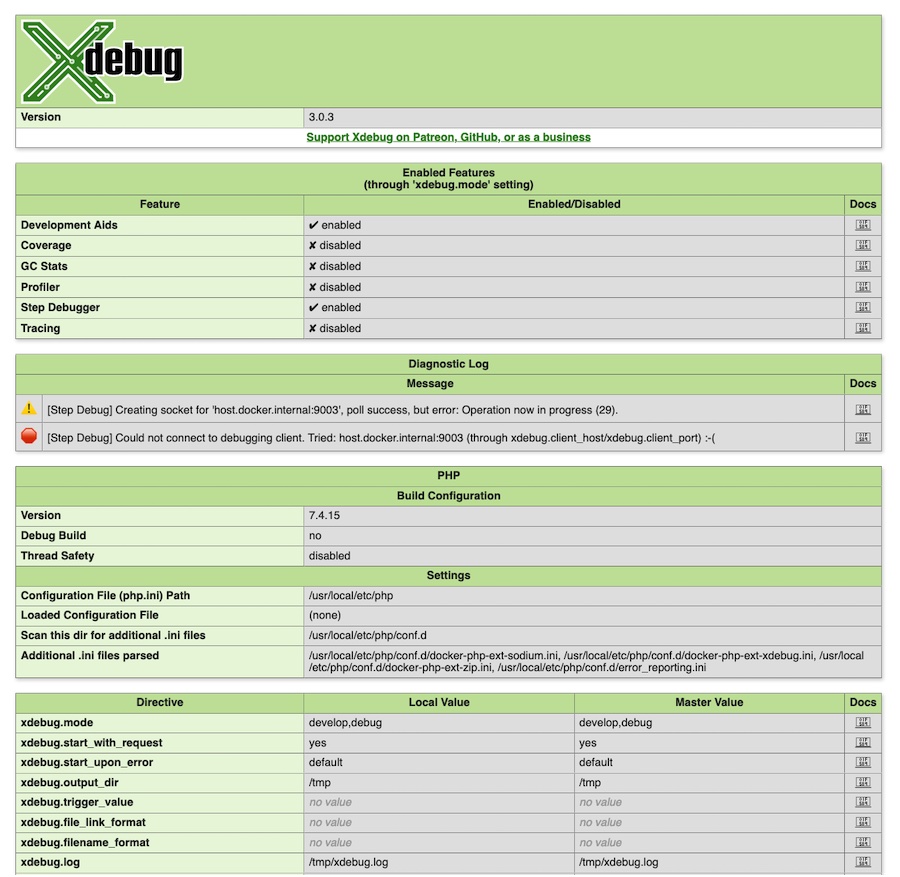
The first thing to look for is whether “Step Debugger” is listed as ✔ enabled.
If not, then, more than likely, the configuration which we created isn’t being used by the container.
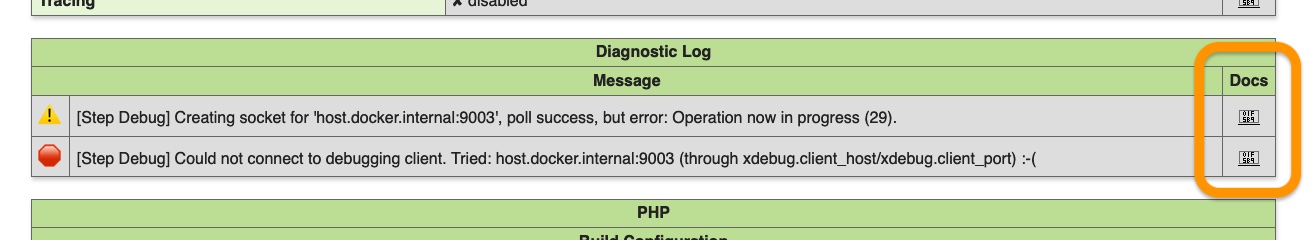
If the step debugger is enabled, next look at the messages in the “Diagnostic Log” block for any messages prefixed with “[Step Debug]”.
If you see any of these, try the following steps:
- Double-check that the configuration settings in the container are the same ones being used by your text editor or IDE
- Ensure that your text editor or IDE is listening for step debugging requests from Xdebug
To learn more about a message, click the icon in the “Docs” column, at the far right-hand side of the entry.
Enable Xdebug’s logging support
Likely a better choice, however, is to enable logging support and then view the log entries that Xdebug writes there.
To do that, you need to enable logging in Xdebug, to record all file creations issues, step debugging connection attempts, failures, and debug communication.
To do so, add the highlighted line below to docker/php/conf.d/xdebug.ini.
[xdebug]
xdebug.mode=develop,debug
xdebug.client_host=host.docker.internal
xdebug.start_with_request=yes
xdebug.log=/tmp/xdebug.log
You can configure the amount of information that Xdebug writes to the log file by making use of xdebug.log_level.
It supports six log levels, which you can see in the table below.
By default, it’s set to 7.
| Level |
Name |
Example |
0 |
Criticals |
Errors in the configuration |
1 |
Errors |
Connection errors |
3 |
Warnings |
Connection warnings |
5 |
Communication |
Protocol messages |
7 |
Information |
Information while connecting |
10 |
Debug |
Breakpoint resolving information |
After you’ve added the new configuration and saved the file, restart the container using the following command:
If step debugging is working, you will see two log entries, similar to those below, in Xdebug’s log file, and your text editor or IDE will stop on the breakpoint that you set.
[Step Debug] INFO: Connecting to configured address/port: host.docker.internal:9003.
[Step Debug] INFO: Connected to debugging client: host.docker.internal:9003 (through xdebug.client_host/xdebug.client_port). :-)
For more information on configuring and troubleshooting Step Debugging in Xdebug, please refer to Xdebug’s documentation.
That’s how you set up step debugging in PHP with Xdebug 3 and Docker Compose
To quickly summarise:
- Install and enable Xdebug 3 in your PHP container
- Set the following Xdebug settings:
**
mode to develop,debug
** client_host to host.docker.internal; and
** start_with_request to yes
- Rebuild the PHP container
- Configure your text editor or IDE and have it listen for PHP debug requests
- Set at least one breakpoint in your code
- Make a request to the code in your browser
- Have fun with step debugging!
Whereas, as many blog posts will attest, before Xdebug 3, it could be quite challenging to set up step debugging when using Docker, in version 3, it’s virtually trivial.
I hope that this guide has shown you that it doesn’t have to be challenging anymore and can be a definitive guide on the subject.


Join the discussion
comments powered by Disqus